Sheet to Dashboard
Dashboard app · built by the Vibecode team
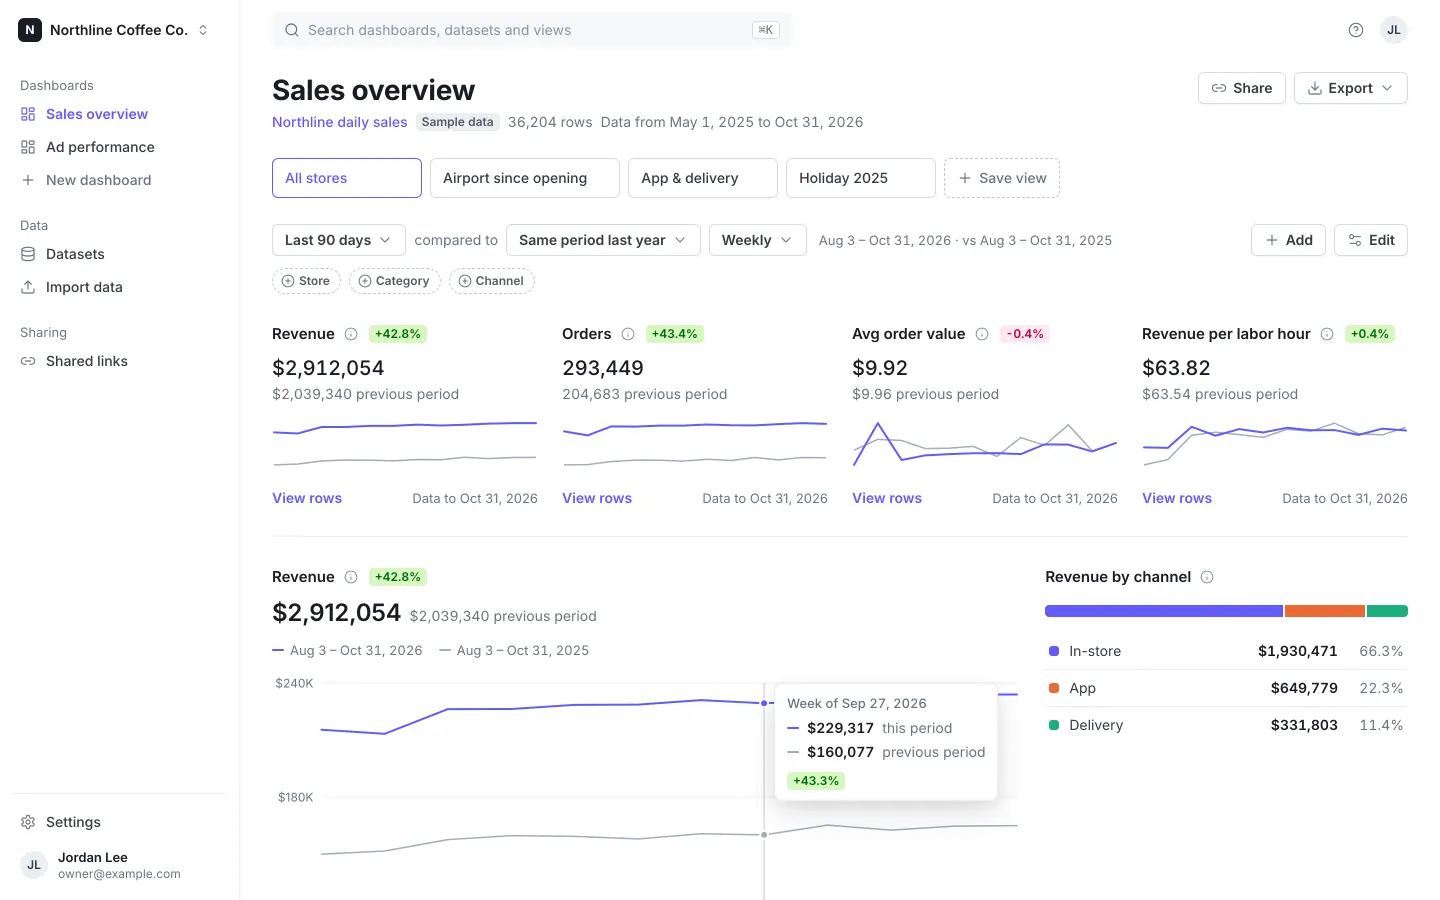
Upload a CSV or Excel file, or paste a public Google Sheets link, and Sheetboard detects dates, money, numbers and categories, shows a preview to fix types, and builds a Stripe-style dashboard. KPI cards compare against the previous period or last year, and the date range, grain and category filters scope every card; click a bar to filter by it. Save views, rearrange or add cards in edit mode, export the dashboard to PDF and rows to CSV, and share a read-only link with an optional password. It opens on a fictional 6-store coffee chain's 18 months of daily sales, with an ad-spend sample one click away; sign in with the demo login shown on the first screen.
- Web app
- Built in 6 prompts
- Free to remix
Remix copies the working app into your account for free, exactly as we built it. It runs in your browser.
The prompt that builds it
We built Sheet to Dashboard in 6 prompts. Here they are folded into one, so a single paste into a new app builds the finished version.
Prompt · 6,441 words
Build a web app called Sheetboard, using Opus 5.5. Sheetboard turns a spreadsheet (CSV, Excel, or a public Google Sheets link) into a live dashboard: KPI cards with period-over-period change, a time-series chart, breakdowns you can click to filter, a top-N table, a searchable drill-down table, saved views, an edit mode to add, remove, resize and configure cards, read-only share links with an optional password, and PDF and CSV export. It is for owners and staff who live in spreadsheets and want a real dashboard. The look is the Stripe Dashboard: light, precise, lots of white, one indigo accent, tabular numbers, crisp small charts.

Design references (the original screenshots are not included; build from these descriptions):
- Reference (Stripe overview kpi cards): "Your overview": the filter row ("Last 7 days" · "compared to" · "Previous period" · "Daily"), "+ Add" and "Edit" buttons on the right, borderless widgets in a 3-column grid with one hairline divider between rows, card title + info icon + green delta badge, value + muted "previous period" value, minimal line charts with only min/max y labels and start/end x labels, "View more" link + muted "Updated 06:23" footer, and the "Payments" segmented bar with legend rows. This is the main dashboard look.
- Reference (Stripe overview edit mode): edit mode: the same widgets become raised white tiles with a soft shadow and an × to remove; buttons become "+ Add" and an indigo "Done".
- Reference (Stripe add widgets modal): the add-widgets modal: a grid of live widget previews, each with a ⊕ (add) or ✓ (selected) toggle, "Cancel" / "Apply" footer.
- Reference (Stripe home today): the app shell: white left sidebar (workspace name top-left, icon + label nav, small section label, item pinned at the bottom), top search field with a light gray fill, and the "Today" chart with hairline gridlines.
- Reference (Stripe transactions table): a table page: big page title, count tabs, dashed "⊕ Date and time / ⊕ Amount / ⊕ Status" filter pills, "Export" and "Edit columns" buttons, table rows with status badges, a "⋯" per row and "6 results" under the table.
- Reference (Stripe customers table): saved segments as outlined tab boxes ("All", "Top customers", "First-time customers"…; the selected one has an indigo border and indigo text), sortable column headers with ⇕ icons, "Copy / Export / Analyse / Edit columns" buttons.
- Reference (Stripe date filter popover): a filter popover anchored under a pill: "Filter by Date and time", a select, inputs, and a full-width indigo "Apply" button.
- Reference (Stripe edit columns popover): the "Edit columns" popover: "Fixed columns", "Active columns" with indigo checkboxes and drag handles.
- Reference (Stripe export modal): a modal: title band, radio groups with values on the right, a select, "Cancel" / "Export" footer.

## Stack and data

- Use the platform's standard backend and database: the Hono backend with Prisma + Better Auth from the database-auth skill (email + password only). The app never sends email: leave out email OTP, magic links and verification emails. Auth must also work inside the Vibecode preview iframe (cross-site cookies set up the way that skill describes). A remix gets backend/.env with BETTER_AUTH_SECRET cleared, so add backend/src/lib/authSecret.ts with ensureAuthSecret(): when BETTER_AUTH_SECRET is empty it reuses a value saved in backend/.env, otherwise generates a random 32-byte base64 secret, saves it to backend/.env and sets process.env. Call it in backend/src/env.ts before the environment is validated, so a fresh copy always boots.
- Seed a demo owner on first run: name "Jordan Lee", email owner@example.com, password sheetboard. The sign-in page shows these credentials (see Sign in).
- Store each dataset's rows as ONE compact JSON text column (array of arrays, column order from the dataset's column list), never one database row per spreadsheet row. Serve rows from GET /api/datasets/:id/rows as { columns, rows } with gzip compression (hono/compress). All filtering and aggregation runs in the browser on those rows, so filters feel instant.
- Prisma models (besides the Better Auth ones): Workspace (name, ownerId), Dataset (workspaceId, name, source: "upload" | "google_sheets" | "sample", sourceName (file name or sheet URL), columns JSON [{ key, name, type: "date" | "money" | "number" | "category" | "text" | "ignore", currency }], rowsJson, rowCount, minDate, maxDate, isSample, refreshedAt), RefreshEvent (datasetId, at, note, rowsBefore, rowsAfter), Dashboard (workspaceId, datasetId, name, cardsJson, createdAt, updatedAt), SavedView (dashboardId, name, position, filtersJson), ShareLink (dashboardId, token, passwordHash nullable, viewId nullable, createdAt, revokedAt, lastViewedAt).
- API under /api (Zod contracts in backend/src/types.ts): datasets CRUD + rows + PATCH column types + PUT data (replace rows; reject if a column used by a dashboard card is missing) + POST refresh (re-fetch a Google Sheets source); POST /api/import/google-sheet { url } (fetches the sheet's CSV server-side and returns columns + rows for review, saves nothing); dashboards CRUD (cardsJson); views CRUD; POST/DELETE share link per dashboard; GET /api/shares; public routes GET /api/public/:token (returns { requiresPassword, title }), POST /api/public/:token/unlock { password } (returns a signed token valid 12 hours), GET /api/public/:token/dashboard (dashboard + views + rows; needs the unlock token if a password is set; updates lastViewedAt). Hash share passwords with Bun.password. Test every route with curl against $BACKEND_URL.
- Google Sheets: accept any share URL form (…/edit#gid=123, …/edit?usp=sharing, …/pubhtml, …/pub?output=csv) and convert it to https://docs.google.com/spreadsheets/d/<id>/export?format=csv&gid=<gid> (gid 0 when missing). If Google answers with an HTML sign-in page or 401/403/404, return the error "This sheet isn't public. In Google Sheets, click Share → General access → Anyone with the link → Viewer, then paste the link again."

## Sample data (fictional, deterministic)

Generate both samples in backend/src/seed/ with a seeded PRNG (mulberry32, seed 20251101) so every install gets identical numbers. Label them honestly everywhere as "Sample data" (fictional business, fictional numbers). No real people anywhere.

1. "Northline daily sales" — a fictional 6-location coffee chain, Northline Coffee Co. Columns in this order: Date (date), Store (category), Category (category), Channel (category), Revenue (money, USD, net of discounts), Orders (number), Discounts (money), Labor hours (number, 1 decimal). One row per Date × Store × Category × Channel.
   - Dates 2025-05-01 to 2026-10-31. Stores and base daily revenue: Midtown $5,400, Old Town $4,600, Riverside $4,100, Harbor $3,700, University $3,300, Airport $6,200. Airport opened 2026-02-02 (no Airport rows before that date). That gives about 36,200 rows.
   - Categories and revenue share: Coffee & espresso 57%, Tea & other drinks 12%, Food & bakery 23%, Beans & retail 8% (Airport: Food & bakery 31%, Beans & retail 4%). Beans & retail ×2.4 from Nov 20 to Dec 24 (holiday gifts).
   - Channels: In-store / App / Delivery shares move linearly from 74/14/12% (May 2025) to 62/25/13% (Oct 2026), with a +3 point App step on 2026-03-02 (the "Northline Rewards" app launch). Airport is 92/6/2.
   - Effects: +0.75% growth per month; weekday multipliers Mon–Sun 1.00, 1.02, 1.03, 1.04, 1.08, 1.12, 0.94 (Harbor Sat 1.30, Sun 1.22; University Sat 0.70, Sun 0.62); month multipliers Jan–Dec 0.90, 0.92, 0.97, 1.00, 1.02, 1.00, 0.98, 0.98, 1.02, 1.04, 1.08, 1.18; Harbor ×1.25 Jun–Aug; University ×0.55 on Jun 1–Aug 20 and Dec 18–Jan 10; Thanksgiving 2025-11-27 ×0.5; Dec 25 ×0.35; about 18% of days are "rainy" for all stores (In-store −12%, Delivery +45%); daily noise ±6%.
   - Orders = revenue ÷ average ticket (In-store $9.80, App $12.60, Delivery $24.50; category factor Coffee 0.85, Tea 0.75, Food 0.95, Beans & retail 1.9), rounded, at least 1. Discounts: 3.5% of gross In-store, 6% App (14% for all of March 2026, the Rewards launch promo), 2% Delivery. Labor hours per store-day = store-day revenue ÷ 64, clamped to 38–140, ±5% noise, split across that store-day's rows in proportion to revenue.
2. "Ad spend by platform" — a fictional online shop's marketing. Columns: Date (date), Platform (category: Google Ads, Meta Ads, TikTok Ads, LinkedIn Ads, Microsoft Ads), Campaign type (category: Search, Prospecting, Retargeting), Spend (money), Impressions (number), Clicks (number), Conversions (number), Revenue (money). Daily from 2025-11-01 to 2026-10-31, one row per Date × Platform × Campaign type (5,475 rows). Base daily spend Google $820, Meta $1,050, TikTok ramping $150 → $700 over the year, LinkedIn $260, Microsoft $120; split Search 45% / Prospecting 35% / Retargeting 20%. CPM Google $9, Meta $11, TikTok $6, LinkedIn $34, Microsoft $8; CTR 3.8%, 1.1%, 0.9%, 0.6%, 3.1%; Retargeting converts about 2.2× and Prospecting about 0.7× the platform rate. Tune conversion rates and revenue per conversion so the 12-month numbers land near real accounts: ROAS Google Ads 4.8×, Microsoft Ads 4.0×, Meta Ads 2.6×, TikTok Ads 1.9×, LinkedIn Ads 1.5× (blended about 3.2×), CPA roughly $14–$60 with LinkedIn highest. Black Friday to Cyber Monday (2025-11-28 to 2025-12-01): spend ×2.2, conversions ×2.8. Daily noise ±8%.

Seed for the demo owner: workspace "Northline Coffee Co.", both datasets, dashboards "Sales overview" (on Northline daily sales) and "Ad performance" (on Ad spend by platform), and these saved views:
- Sales overview: "All stores" (Last 90 days, compared to Same period last year, Weekly; the default view), "Airport since opening" (Store = Airport; Feb 2 – Oct 31, 2026; No comparison; Monthly), "App & delivery" (Channel = App, Delivery; Last 90 days; Same period last year; Weekly), "Holiday 2025" (Nov 15, 2025 – Jan 4, 2026; Previous period; Daily).
- Ad performance: "All platforms" (Last 90 days vs Previous period, Weekly), "Black Friday 2025" (Nov 24 – Dec 7, 2025; Daily), "Paid social" (Platform = Meta Ads, TikTok Ads; Last 90 days; Weekly).
A newly signed-up user gets an empty workspace named after them ("Alex's workspace") and lands on Import data, where "Try a sample" copies either sample (dataset + dashboard + views) into their workspace. Make that copy fast and light: generate each sample once and reuse its stored rowsJson and columns (never regenerate 36K rows per request), and create the dataset, dashboard and views in one transaction.

## Design system (override the shadcn defaults; it must not look like default shadcn)

- Font: Inter Variable (@fontsource-variable/inter), body 14px/20px, antialiased. tabular-nums on every table cell, axis tick, delta badge and legend value. Big KPI values use normal figures.
- Colors: page and cards #FFFFFF; subtle surface #F6F8FA (search field, row hover, banners, skeletons); hairline #EBEEF1 (row dividers, card borders, gridlines); control border #D5DBE1; dashed pill border #C0C8D2; heading text #1A1B25; body text #353A44; secondary text #687385; placeholder #8792A2. ONE accent, indigo #635BFF (hover #5851EA, active #4B45C6, focus ring 0 0 0 3px rgba(99,91,255,0.25), selected wash rgba(99,91,255,0.06)). Links and active nav are #635BFF. No gradients, no glassmorphism, no emoji, no purple-blue backgrounds.
- Badges (12px/600, radius 4px, padding 1px 6px): positive bg #D7F7C2 text #006908; negative bg #FFE7F2 text #B3093C; neutral bg #EBEEF1 text #545969; "Sample data" uses neutral.
- Type: page title 28px/36px weight 700 #1A1B25; section title 16px/600; card title 15px/600 #1A1B25; labels 13px/500 #687385; small 12px.
- Spacing scale 4/8/12/16/20/24/32/40. Page padding 32px desktop, 16px phone. Content max width 1280px.
- Buttons 32px tall, radius 6px, 14px/600, icon 16px + 6px gap. Outline: white, 1px #D5DBE1, shadow 0 1px 1px rgba(0,0,0,0.04), hover bg #F6F8FA. Primary: #635BFF with white text, used only for the one main action on a screen (Done, Apply, Create dashboard, Sign in, Save). Danger text #B3093C.
- Inputs 36px, radius 6px, 1px #D5DBE1, focus border #635BFF + ring.
- Icons: lucide-react 16px, stroke 1.75, color #687385 (indigo when active).
- Popovers and menus: white, 1px #EBEEF1, radius 8px, shadow 0 5px 15px rgba(0,0,0,0.08), 0 15px 35px -5px rgba(25,28,33,0.12); open with a 120ms fade + 0.98→1 scale. Modals: same shadow, radius 10px, overlay rgba(26,27,37,0.35), title band 56px. Side sheets slide in from the right in 200ms cubic-bezier(.2,.8,.2,1). Toasts: bottom center, #1A1B25 background, white 14px text, check icon, 3s.
- Charts (Recharts, from the template's chart setup; follow these rules exactly): single-series charts are indigo #635BFF; lines 2px with round joins and no area fill; the y domain is padded around the data (from a rounded value just below the lower of both series to one just above the higher), never forced to zero; previous-period comparison line #A3ACBA 1.5px solid; gridlines and axes are 1px solid #EBEEF1 (never dashed); axis labels 12px #687385 tabular-nums, compact ($0, $20K, $1.2M); y axis shows 3 ticks (0, middle, max); bars at most 24px thick with 4px rounded ends at the value end and square at the baseline, with a 2px white gap between touching marks; markers r=4 with a 2px white ring. Multi-series categorical order is fixed and never cycled: #635BFF, #EB6834, #1BAF7A, #EDA100, #E87BA4, then fold the rest into "Other" #A3ACBA. A color stays with its value when filters change. Never a dual-axis chart, never 3D, never a rainbow. Text never wears the series color (values and labels use text colors; a colored swatch or line key beside them carries identity). Every chart has a hover layer: line/area charts get a vertical hairline crosshair (#C0C8D2) that snaps to the nearest date, dots on each series, and one tooltip listing every series (value first in 14px/600 #1A1B25, label after in #687385, short line keys, not boxes); bars get a per-bar tooltip and lighten to #7A73FF on hover. Legends appear whenever there are 2+ series. Chart entry animation 400ms only on first render; filter changes re-render without a re-animation flash.
- Loading: first load shows #F6F8FA skeleton blocks in the shape of the cards. When filters change or data refetches, cards keep their previous render at 60% opacity until the new numbers are ready (no skeleton flash, no layout jump).

## App shell

- Left sidebar 240px, white, 1px #EBEEF1 right border. Top: workspace row (24px #1A1B25 rounded-6 tile with a white "N", "Northline Coffee Co." 14px/600, chevron; menu: "Workspace settings", "Sign out"). Nav rows 32px, 14px/500 #353A44, 16px icon, radius 6px, hover #F6F8FA, active = #635BFF icon + text, weight 600:
  - Section label "Dashboards" (13px #687385): "Sales overview", "Ad performance" (LayoutDashboard icons), "New dashboard" (Plus icon, muted).
  - Section "Data": "Datasets" (Database), "Import data" (Upload).
  - Section "Sharing": "Shared links" (Link2).
  - Pinned at the bottom: "Settings" (Settings icon) and the user row (28px initials avatar "JL" on #EBEEF1, "Jordan Lee" 13px/600, "owner@example.com" 12px #687385).
- Top bar 60px, no border: search field 520px wide, #F6F8FA fill, radius 6px, Search icon, placeholder "Search dashboards, datasets and views", "⌘K" hint chip on the right. ⌘K or a click opens one command palette (cmdk) listing dashboards, datasets and saved views with type icons; Enter navigates. Matching is a case-insensitive substring match on names with word-start matches first (typing "air" shows only "Airport since opening"); empty groups are hidden, and no match shows "No results for “air”". Right side: a HelpCircle icon button (popover "How Sheetboard works": 3 numbered lines: "Import a CSV, Excel file or Google Sheet", "We detect dates, money, numbers and categories and build a dashboard", "Filter, edit cards, save views, and share a read-only link") and the user avatar.
- Product mark: 20px #635BFF rounded square (radius 5px) with three white ascending bars, wordmark "Sheetboard" 15px/700 #1A1B25. Use it on sign-in, public share pages, the favicon (SVG + replace public/favicon.ico) and a new 1200×630 og:image (white background, the mark, "Sheetboard", "Turn any spreadsheet into a live dashboard", and a crisp indigo line chart; render it from an SVG into public/og.png, e.g. with @resvg/resvg-js or sharp). Replace every template favicon/og-base.png. Page titles: "<Page> · Sheetboard". Nothing in the UI, favicon or share image mentions Vibecode.

## Sign in (/sign-in) and sign up (/sign-up)

White page, centered 400px column: product mark + wordmark, title "Sign in to Sheetboard" (24px/700), subtitle "Your spreadsheets, as live dashboards." Then a demo callout (bg #F6F8FA, 1px #EBEEF1, radius 8px, padding 12px 14px): "Demo owner login" (13px/600), "owner@example.com · sheetboard" (13px, monospace), and a link button "Use demo login" that fills both fields. Fields "Email" and "Password", primary full-width "Sign in", error text "Email or password is incorrect." under the button on failure, then "New to Sheetboard? Create an account". Sign up: "Create your account" with "Name", "Email", "Password (8+ characters)", "Create account". After sign-in go to the last opened dashboard (first time: /d/<Sales overview id>). Unauthenticated app routes redirect to /sign-in.

## Dashboard page (/d/:dashboardId) — the money screen

Top to bottom, desktop 1440×900:

1. Header row: title "Sales overview" (28px/700) and, under it, a 14px #687385 meta line: dataset name as a link ("Northline daily sales"), the neutral "Sample data" badge, "36,204 rows", "Data from May 1, 2025 to Oct 31, 2026". Right side: outline buttons "Share" (Link2 icon) and "Export" (Download icon, chevron) — the Export menu has "Download PDF" and "Download CSV (filtered rows)".
2. Saved views row (Stripe customers tabs): outlined boxes 40px tall, min-width 150px, radius 6px, 1px #D5DBE1, 14px/500 #353A44, gap 8px: "All stores", "Airport since opening", "App & delivery", "Holiday 2025", then a dashed box "+ Save view". Selected: 1px #635BFF border, #635BFF text, selected wash. Each box shows a "⋯" on hover with "Rename" and "Delete". When the current filters differ from the selected view, a 6px indigo dot appears on its box and two text buttons appear at the right end of the row: "Update view" and "Save as new". "+ Save view" opens a small popover: "Name" input + "Save".
3. Filter row (Stripe overview row), one line: outline button "Last 90 days" ▾, the words "compared to", outline button "Previous period" ▾, outline stepper button "Weekly" ⇕; after them, muted 13px text "Aug 3 – Oct 31, 2026 · vs Aug 3 – Oct 31, 2025". Right end: outline "+ Add" and outline "Edit" (Settings icon).
   - Date menu (presets as rows with a 16px check on the selected row; hover is a ghost wash): Last 7 days, Last 30 days, Last 90 days, Last 12 months, Month to date, Quarter to date, Year to date, All time; below a hairline, "Custom range…" which shows From / To date inputs and an indigo "Apply". Presets are anchored to the dataset's LAST date, not today, so old data still works.
   - Compare menu: Previous period, Same period last year, No comparison (when there's no data for the comparison range, show "—" instead of a delta).
   - Grain: Daily, Weekly, Monthly (auto-pick Weekly above 120 days, Monthly above 400 days, but the user can override). On import, detect the data's natural grain from the median gap between distinct dates (≥ 28 days = monthly, ≥ 7 = weekly, else daily) and store it on the dataset; never default to a finer grain, and disable finer grains with the tooltip "Your data is monthly". Line, area and sparkline charts never plot a leading bucket shorter than a full week or month (KPI totals still include those days).
   - Comparisons with no data: when the comparison range starts before the dataset's first date, show no delta badge, replace "… previous period" with "No earlier data to compare" (13px #687385), draw no gray comparison line or sparkline, and show "—" in "vs previous" table cells.
4. Dimension filter row: one dashed pill per category column with ≤ 50 distinct values ("⊕ Store", "⊕ Category", "⊕ Channel"; 26px tall, radius 999px, 12px/600 #545969). A pill opens a popover (Stripe filter popover): title "Filter by Store", a search input, checkbox list with row counts on the right ("Midtown 1,080", counted within the current date range), "Select all" / "Clear" links, full-width indigo "Apply". Active pill turns solid (#D5DBE1 border) and reads "Store | Midtown, Harbor" with an ⊗ to clear. A "Clear filters" link appears when any filter is active. Filters and view live in the URL query string, so reload and back/forward keep them. Every card below re-renders from the same filtered slice.
5. Cards on a 12-column grid (gap 24px). Consecutive KPI cards always form one strip of equal-width columns (4 KPIs → four columns, 5 → five, 6 → six, 7 or more wrap into balanced rows of at most 6; 2 per row on phone); charts below keep their own rows. VIEW mode is borderless like the Stripe overview: no card borders or shadows, cards separated by whitespace, with a 1px #EBEEF1 hairline between grid rows. Each card has: title (15px/600) + an info icon whose tooltip explains the metric ("Sum of Revenue for rows in range"), a delta badge when relevant, the content, and a footer: "View rows" link (#635BFF 14px/600; scrolls to All rows) on the left and muted "Data to Oct 31, 2026" on the right. Default "Sales overview" cards, in order:
   - KPI "Revenue" (Sum of Revenue, money) — span 3
   - KPI "Orders" (Sum of Orders) — span 3
   - KPI "Avg order value" (Revenue ÷ Orders, money) — span 3
   - KPI "Revenue per labor hour" (Revenue ÷ Labor hours, money) — span 3
   KPI anatomy: title + info + delta badge (e.g. "+8.4%"; green when the change is good, red when bad; each card has "Higher is better" or "Lower is better"); value 24px/600 #1A1B25 ("$2,384,920"; no cents at or above $10,000; "$11.42" style below); then, always on its own line directly under the value, "$2,201,410 previous period" in 14px #687385; then a 56px sparkline (indigo current, gray previous) with no axes.
   - Line chart "Revenue" — span 8: title + delta badge, value + previous-period value like the KPI, a legend with line keys "Aug 3 – Oct 31, 2026" (indigo) and "Aug 3 – Oct 31, 2025" (gray), the chart 260px tall, 3 y ticks, 5 x labels ("Aug 3", "Aug 31"…), and the crosshair tooltip ("Week of Sep 14, 2026" / "$184,203 this period" / "$171,880 previous period" / "+7.2%").
   - Share card "Revenue by channel" — span 4, like Stripe's "Payments" widget: a 12px segmented bar (radius 4px, 2px white gaps) in category order #635BFF / #EB6834 / #1BAF7A, then legend rows 36px with hairlines: 10px rounded swatch, "In-store", value right "$1,520,301" (600) and share "63.7%" (#687385). Clicking a row filters Channel to it.
   - Horizontal bar chart "Revenue by store" — span 6: one row per store, sorted by value; label column 120px on the left, indigo bar, value at the bar's end (13px/600). Clicking a bar toggles a Store filter (shift/cmd-click adds more). While a store filter is active, the selected bars stay indigo and the others turn #D5DBE1. Tooltip "Midtown · $612,830 · 25.7% of total · Click to filter".
   - Column chart "Orders by category" — span 6: 4 indigo columns (24px wide), value on each cap, category names under them (wrap to 2 lines), click to filter Category.
   - Top-N table "Store leaderboard" — span 12: columns "#" (muted), Store, Revenue, "vs previous" (delta badge), Orders, Avg order value, Discount rate (Discounts ÷ Revenue, percent, lower is better), Revenue / labor hr. Sorted by Revenue, top 10, "Other" row when more; a small outline "Export CSV" button in the card header.
   - Drill-down table "All rows" — span 12: header has a 240px search input ("Search rows"), outline "Edit columns" (Stripe popover: checkboxes to show/hide columns, drag to reorder), outline "Export CSV" (exports every filtered and searched row, all pages, original column names, file "northline-daily-sales-2026-11-03.csv"). Table: 36px rows, hairline dividers, hover #F6F8FA, header 13px/600 #1A1B25 with ⇕ sort icons (↑/↓ when active), numbers right-aligned tabular, money with cents ("$412.50"), dates "Oct 31, 2026", category cells as plain text except Channel which uses a neutral badge. Footer: "Showing 1–25 of 6,480 rows" left, outline "Previous" / "Next" right. Search and sort apply to the filtered rows.
   The "Ad performance" dashboard follows the same pattern: KPIs Spend, Revenue, ROAS (Revenue ÷ Spend shown "3.42×"), CPA (Spend ÷ Conversions, lower is better); line "Spend"; share "Spend by platform" (5 colors in the fixed order); horizontal bars "ROAS by platform"; columns "Conversions by campaign type"; table "Platform leaderboard" (Spend, Revenue, ROAS, Conversions, CPA, CTR = Clicks ÷ Impressions); All rows.
6. Empty states: no rows for the filters → each card shows "No data for these filters" (13px #687385) and a "Clear filters" link; KPI values show "—". A dashboard with no cards shows "This dashboard is empty" with an indigo "+ Add cards" button.

## Edit mode

- "Edit" switches the page into edit mode: every card becomes a raised white tile (1px #EBEEF1 border, radius 8px, padding 20px, shadow 0 2px 5px rgba(60,66,87,0.08), 0 1px 1px rgba(0,0,0,0.12), 150ms transition), with 20px of space below its footer so nothing touches the border, a 6-dot drag handle at top-left (drag to reorder with @dnd-kit, the grid reflows), a "⋯" menu (Edit card, Size → Small 1/4 · Medium 1/3 · Large 1/2 · Wide 2/3 · Full width with a check on the current one, Duplicate, Remove) and an × at top-right that removes the card. The right side of the filter row shows "+ Add", an outline "Cancel" and an indigo "Done". "Done" saves the layout to the backend and shows the toast "Dashboard saved". "Cancel" leaves edit mode and discards unsaved changes, asking "Discard changes?" first if anything changed (leaving the page with unsaved changes asks the same).
- "+ Add" opens the "Add cards" modal (Stripe add-widgets modal): a 3-column grid of live mini previews built from this dataset (for the coffee data: "Discount rate" KPI, "Discounts" KPI, "Labor hours" KPI, "Orders over time" line, "Revenue by weekday" columns, "Avg order value by channel" bars, "Revenue by category" share, "Category leaderboard" table, and "Custom card"), each with a ⊕ that toggles to an indigo ✓. Previews never show card header actions (no Export CSV). The "Custom card" tile shows a Plus icon in a 32px #F6F8FA circle, "Custom card" (15px/600) and "Pick any metric, grouping and chart" (13px #687385), and opens the Edit card sheet with a new card. Footer "Cancel" / "Apply": new KPI cards go right after the last KPI card and every other new card goes right above "All rows", which always stays last. Duplicate puts the copy right after the original.
- "Edit card" opens a 420px side sheet "Edit card" with a live preview at the top and these fields: Title; Visualization as an icon segmented control (Number, Line, Area, Bars, Horizontal bars, Share, Table); Metric = Column (money/number columns plus "Rows (count)") + Aggregation (Sum, Average, Min, Max, Count) + optional "Divide by" column (sum ÷ sum, for ratios); Format (Auto, Money, Number, Percent, Multiplier ×); "Higher is better" / "Lower is better"; Group by (category columns plus "Weekday" and "Month" derived from the date column) for bars/share/table; Time grain (Follow filters, Day, Week, Month) for line/area; Show top (5, 8, 10, 20, with "Group the rest as Other"); Sort (Largest first, Smallest first, A–Z); Size. Footer: "Remove card" (danger text, left), "Cancel", indigo "Save". Changes persist after reload.

## Import data (/import)

Page title "Import data", subtitle "Turn a spreadsheet into a live dashboard in under a minute." A 3-step header: "1 Choose source — 2 Review columns — 3 Dashboard" (current step indigo, done steps with a check).

Step 1: three radio cards in a row (selected = indigo border + wash): "Upload a file" (FileSpreadsheet icon, "CSV or Excel, up to 20 MB"), "Google Sheets" (Sheet icon, "Paste a public share link"), "Try a sample" (Database icon, "Explore with realistic demo data").
- Upload: a 220px dropzone (1.5px dashed #C0C8D2, radius 8px, bg #FCFCFD): UploadCloud icon, "Drag and drop a CSV or Excel file" (15px/600), "or browse files" (indigo link), "Supports .csv, .xlsx and .xls up to 20 MB. The first row must be column names." Drag-over: solid #635BFF border, indigo wash, text "Drop to upload". Parse in the browser with PapaParse (CSV) and SheetJS (xlsx/xls: read date cells with cellDates false and XLSX.SSF.parse_date_code into plain "YYYY-MM-DD" strings, and never convert stored dates through the local time zone anywhere, in parsing, bucketing, labels or the PDF; if the workbook has several sheets, show a "Sheet" select on the review step). While parsing: "Reading northline_sales.csv…" with a thin indigo progress bar. Errors: "That file type isn't supported. Upload a .csv, .xlsx or .xls file.", "This file has no rows.", "This file is larger than 20 MB."
- Google Sheets: name the dataset after the spreadsheet's real title (the server fetches https://docs.google.com/spreadsheets/d/<id>/htmlview and takes the <title> text without " - Google Sheets"; fallback "Google Sheet"). Label "Google Sheets link", placeholder "https://docs.google.com/spreadsheets/d/…", helper "Share the sheet as “Anyone with the link can view”. We import the tab in your link (or the first tab).", indigo "Import sheet"; loading "Fetching sheet…"; errors shown inline in #B3093C.
- Try a sample: two cards. "Coffee chain sales" — "6 stores · 18 months of daily sales · 36,204 rows" with column chips (Date, Store, Category, Channel, Revenue, Orders, Discounts, Labor hours), button "Use this sample". "Marketing ad spend" — "5 ad platforms · 12 months · 5,475 rows" with its chips, "Use this sample". For a user who already has that sample, the button reads "Open dashboard".

Step 2, Review columns: a summary bar "northline_sales.csv · 36,204 rows · 8 columns", a "Dataset name" input prefilled from the file name ("Northline sales"), then a preview table of the first 20 rows (sticky header, horizontal scroll). Above each column: its name and a type select with an icon — Date (Calendar), Money (DollarSign), Number (Hash), Category (Tag), Text (Type), Ignore (EyeOff) — plus a small muted "Auto" tag on detected types. Detection: Date when ≥ 90% of non-empty values parse (ISO, 10/31/2026, 31/10/2026 when the first part is above 12, Oct 31 2026, Excel dates); Money when numeric and the values carry a currency symbol ($ € £ ₹) or the header contains revenue, sales, spend, cost, price, amount, discount, profit, fee or total; Number when ≥ 95% numeric after removing commas, spaces and %; Category when text with ≤ 50 distinct values and distinct values ≤ 50% of non-empty rows; otherwise Text (so a mostly unique column such as names is Text). Values that don't fit the chosen type get a #FFE7F2 cell background and the column shows "3 invalid" in #B3093C ("Invalid values are left empty"). Under the table: "Dates from May 1, 2025 to Oct 31, 2026 (column Date)" or the notice "No date column found. Time charts will be skipped — set a column to Date if one holds dates." Buttons: outline "Back", indigo "Create dashboard".

Step 3: "Building your dashboard…" for a moment, then go to the new dashboard with the toast "Dashboard created from Northline sales". Auto-build rules: the first date column is the time axis; up to 4 KPIs from money then number columns (Sum), plus "Rows" count if fewer than 2 numeric columns; a line chart of the first money/number column; a share card for the category column with the fewest values (2–8); horizontal bars for the next category column; a top-N table grouped by the category column with the most values (≤ 50) showing every numeric column; and All rows. Default range: Last 90 days compared to Previous period when the data spans at least 180 days, otherwise All time with No comparison. Monthly data opens on Last 12 months, Monthly, compared to Same period last year when there are at least 24 months of data, otherwise No comparison. Datasets with no date column hide the date, comparison and grain controls (that row keeps only the muted "30 rows · no date column" text) and get a KPI row of "Rows" plus "Distinct <column>" for the first 3 category columns (each span 3).

## Datasets (/datasets) and dataset detail (/datasets/:id)

- List page: title "Datasets", outline "Import data" button; Stripe table with columns Name (+ "Sample data" badge), Source ("Upload · northline_sales.csv", "Google Sheets", "Sample"), Rows, Columns, Dashboards, Last refreshed ("2 min ago", "Yesterday", "Oct 31, 2026"); "2 results" under it. Empty state: "No datasets yet" + "Import data".
- Detail page: title = dataset name with the source as a muted line; actions: outline "Replace data", outline "Refresh from Google Sheets" (only for that source), "⋯" (Rename, Delete — delete asks to confirm and lists the dashboards it removes). Sections: "Columns" table (Name, Type select — changing it saves and re-renders dashboards, Example values, Empty cells), "Preview" (first 50 rows), "Dashboards" (links), "Refresh history" (e.g. "Nov 3, 2026, 2:41 PM · Replaced from northline_sales_nov.csv · 36,204 → 36,876 rows").
- Replace data (re-upload to refresh, keeps the dashboard): a modal with the same dropzone. After parsing it shows a column check list: each existing column with a green check if found, "Missing" (red badge) if not, and new columns as "New" (neutral badge); "36,204 rows → 36,876 rows". Indigo "Replace data" is disabled if a column used by a card is missing ("Revenue is used by 6 cards"). On success: toast "Data replaced · dashboards updated"; every dashboard on this dataset keeps its cards and views and shows the new numbers.

## Settings (/settings)

Sections: "Workspace" (Workspace name + Save), "Sample data" with the line "Restore Northline daily sales and Ad spend by platform, with their dashboards and saved views, to the original sample." and an outline "Reset sample data" button (confirm dialog: "This restores Northline daily sales and Ad spend by platform, their dashboards and saved views to the original sample. Your own imports are kept."; toast "Sample data restored"), and "Account" (avatar, name, email, "Sign out").

## Everywhere

- Scroll to the top on every route change.
- Any request that can fail (import, samples, replace, save, share, views, settings) shows "Couldn't reach the server. Check your connection and try again." with a "Try again" button, never a raw "Failed to fetch".
- Counts use the right singular or plural ("1 card", "2 cards", "1 row").
- Every visible field label is linked to its input (htmlFor/id), including selects in the card editor, Save view, Share and the custom date range.

## Share and public view

- "Share" opens a modal "Share “Sales overview”": a switch "Public link" with the line "Anyone with the link can view this dashboard. They can't edit it or see your other data."; when on, a read-only link field with an outline "Copy" button (becomes "Copied" with a check for 2s); "Opens with" select (Current filters or one of the saved views); a checkbox "Require a password" that reveals a password input (min 4 characters) and "Save password"; a danger text button "Revoke link"; footer "Done". The share link is <origin>/s/<token>.
- "Shared links" page: table Dashboard, Link (copy icon), Password (Yes/No), Opens with, Created, Last viewed, and a "Revoke" text button per row. Empty state: "No shared links yet".
- Public page /s/:token (no sign-in): slim top bar with the product mark and a neutral "View only" badge (downloads live in the header "Export" menu: Download PDF and Download CSV). Then the dashboard title, meta line, the saved-view tabs (read-only), filter rows and all cards, without Edit, Add, Share or saving views. Viewers can change filters and search/sort/export the rows table. Footer: "Shared with Sheetboard" (12px #687385). Password gate when set: centered 360px card with a Lock icon in a 32px #F6F8FA circle, "This dashboard is password protected", a password field, indigo "View dashboard"; wrong password → "That password isn't right. Try again." Revoked or unknown token → "This link is no longer active."

## Export

- "Download PDF": render the dashboard area (not the sidebar, top bar or edit controls) with html-to-image at 2× (not html2canvas, which breaks on modern CSS colors) into a jsPDF landscape Letter document: a header line "Sales overview — Northline Coffee Co.", a second line with the range, comparison and active filters ("Aug 3 – Oct 31, 2026 vs May 5 – Aug 2, 2026 · Store is Midtown"), the dashboard image split across pages when tall, and a footer "Generated Nov 3, 2026, 2:41 PM · Sheetboard". File name "sales-overview-2026-11-03.pdf". Show "Preparing PDF…" in the button while working, then the toast "PDF downloaded".
- CSV exports use the original column names and keep money as plain numbers.

## Phone (390 px wide)

- The sidebar becomes a 56px top bar: menu icon (opens the sidebar as a 280px drawer over a dim overlay), the workspace name, the avatar. Page padding 16px; page title 22px/700; header actions become a "Share" icon button and a "⋯" menu (Download PDF, Download CSV, Edit dashboard, Add cards).
- Saved-view tabs, the filter row and the dimension pills each become one horizontally scrolling line (no wrapping, 36px touch targets, hidden scrollbars).
- KPI cards stack in a 2-column grid (gap 12px) with compact values ("$2.38M", "$11.42"), the delta badge under the value and a 40px sparkline. Every other card is full width; charts 200px tall with 3 x labels.
- Tables scroll horizontally inside their card with the first column sticky; the "All rows" footer shows "1–25 of 6,480" with icon-only Previous/Next.
- Modals open as bottom sheets (radius 16px top); the card editor is a full-screen sheet. In edit mode on phone each card shows ×, ↑ and ↓ (no drag, no size).
- Nothing may overflow the page horizontally at 390 px.

## Build order

Build it in small source files (under ~250 lines each), in this order, and get each step running before the next:
1. Download and look at the refs.
2. Backend: database-auth (Prisma + Better Auth), schema, seed generators (backend/src/seed/prng.ts, coffee.ts, ads.ts, seed.ts that runs on startup when the demo owner is missing), routes, curl tests (sign in as owner@example.com, list dashboards, rows count 36,204-ish for Northline).
3. Frontend foundations: tokens in index.css, fonts, ProductMark, AppShell (Sidebar, TopBar, MobileNav), SignIn/SignUp, API client.
4. src/lib/data: types.ts, parse.ts (CSV/XLSX), detect.ts (types), filter.ts, aggregate.ts (sum/avg/min/max/count/ratio, group by, time buckets, previous period), format.ts (money, compact, percent, ×, dates like "Oct 31, 2026", relative "2 min ago").
5. Dashboard page: Header, ViewTabs, FilterBar (DateMenu, CompareMenu, GrainButton, DimensionPill), and one file per card: KpiCard, LineCard, ShareCard, HBarCard, ColumnCard, TopTableCard, RowsTableCard.
6. Edit mode: SortableGrid, CardMenu, AddCardsModal, CardEditorSheet.
7. Import flow, Datasets list/detail, Replace data.
8. Saved views, ShareModal, Shared links page, public /s/:token page with password gate.
9. PDF and CSV export.
10. Phone layout pass, favicon, og:image, titles.
11. Clean-up before you finish: delete every test dataset, dashboard, share link and account except the demo owner, reset the samples, delete Session and Verification rows, run `PRAGMA wal_checkpoint(TRUNCATE); VACUUM;` on the SQLite file, and delete refs/ and any test scripts, screenshots or recordings.

Build it fully, run it, and fix every error. Check at desktop and 390px that the browser console is clean, the sign-in works with the demo login, the Sales overview opens full of data, filters and clicking bars change every card, edit mode saves after reload, imports of a CSV, an Excel file and a public Google Sheet build sensible dashboards, a new account can install both samples, and a share link opens read-only. Deliver the complete app, not a plan.
More templates
All templates- View template

Studio Booking
WebA salon site where clients book real free times in 30 seconds, plus an owner admin that runs the day.
- View template
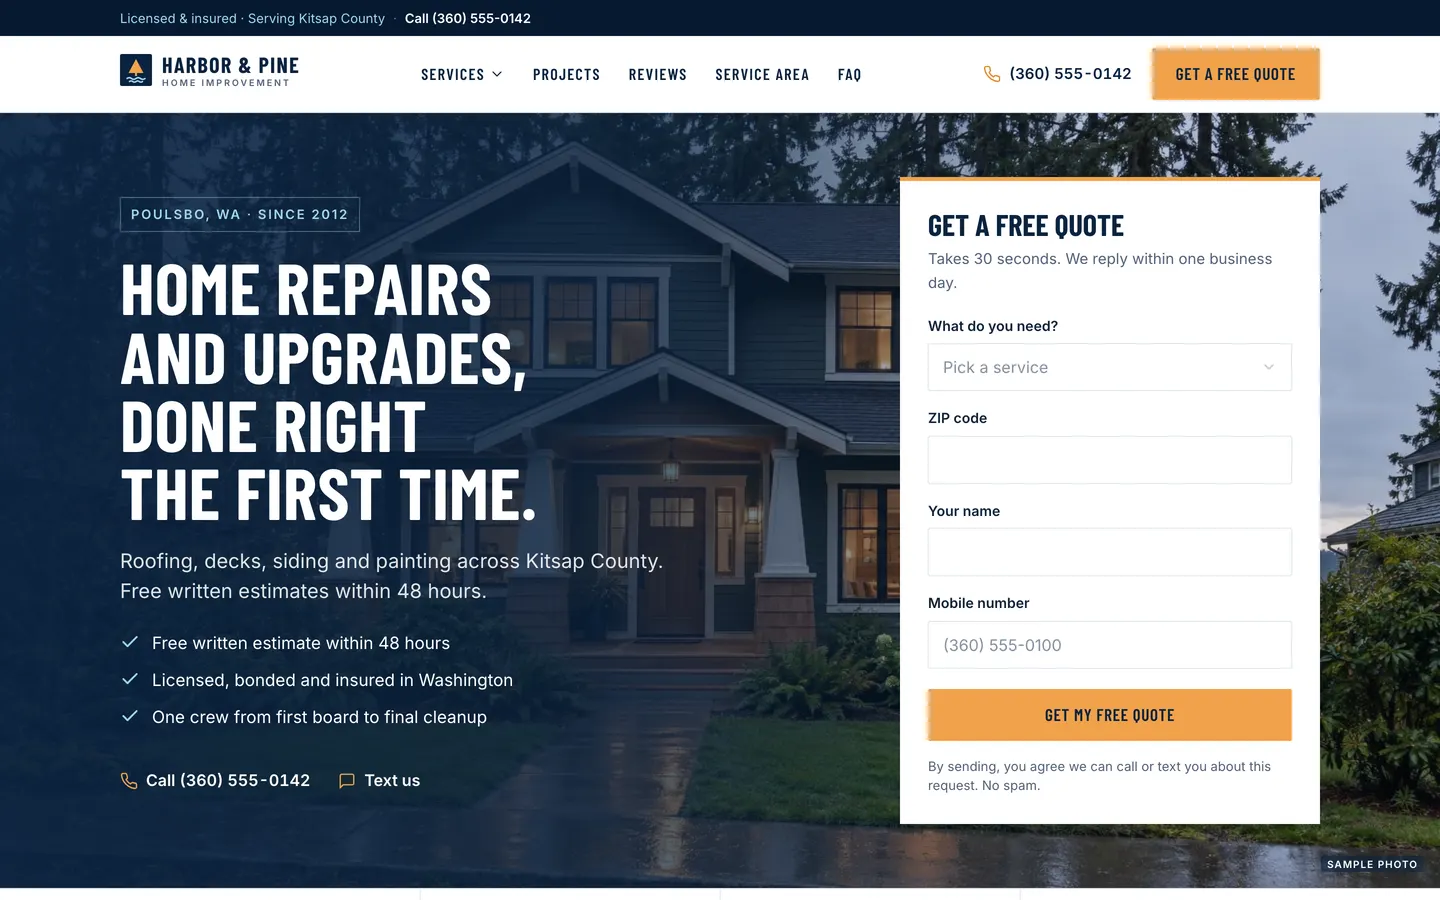
Local Pro Quotes
WebContractor website with a quote form in the hero, a project map, a ballpark estimator and a built-in lead CRM.
- View template
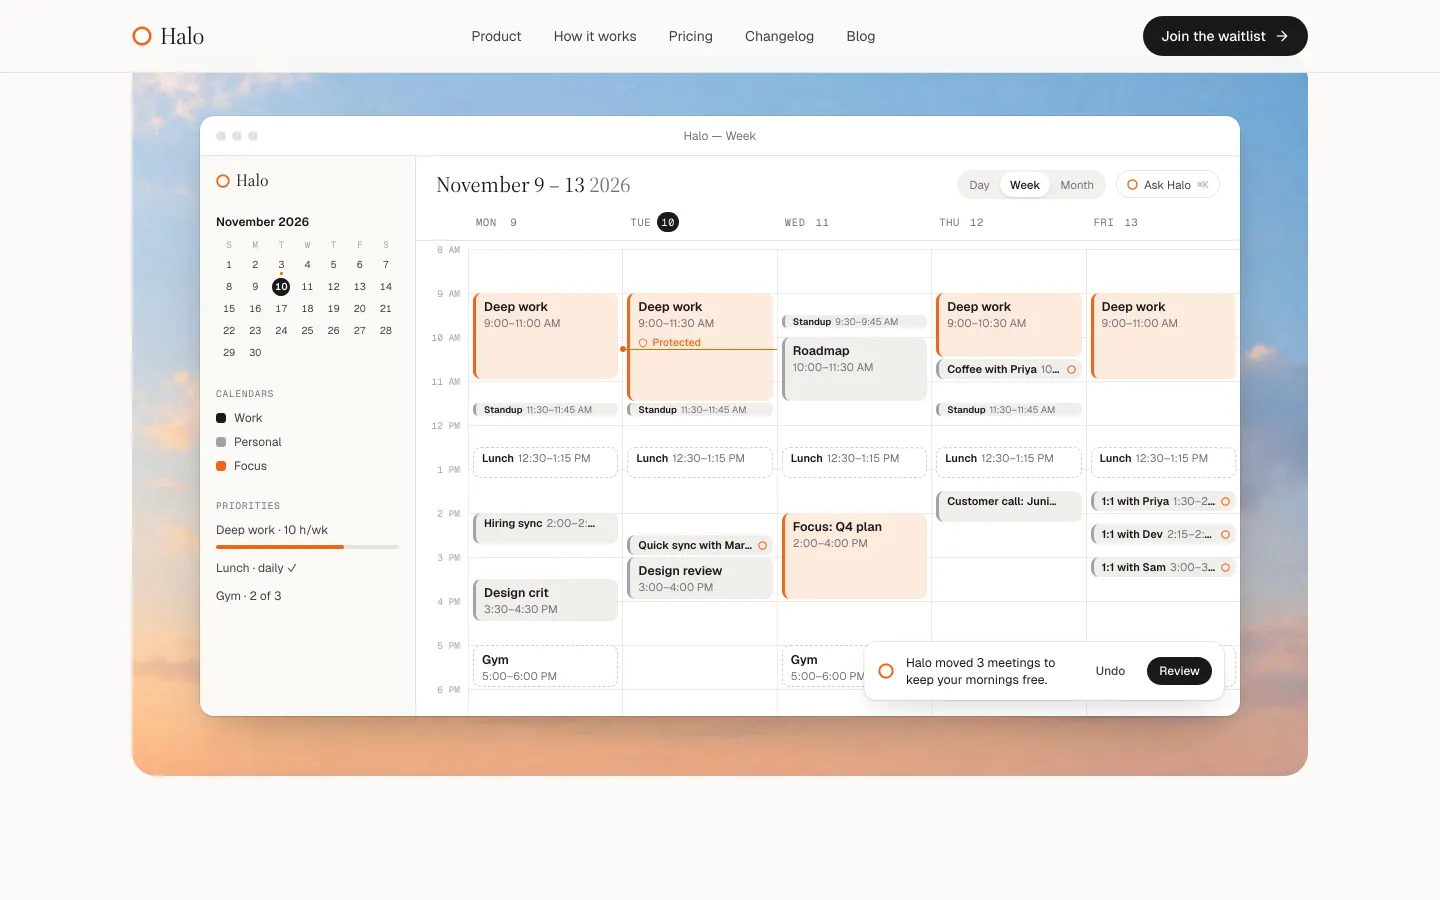
Launch Page
WebAn editorial launch page with a real waitlist: live spot numbers, referral boosts, owner admin and CSV export.
- View template
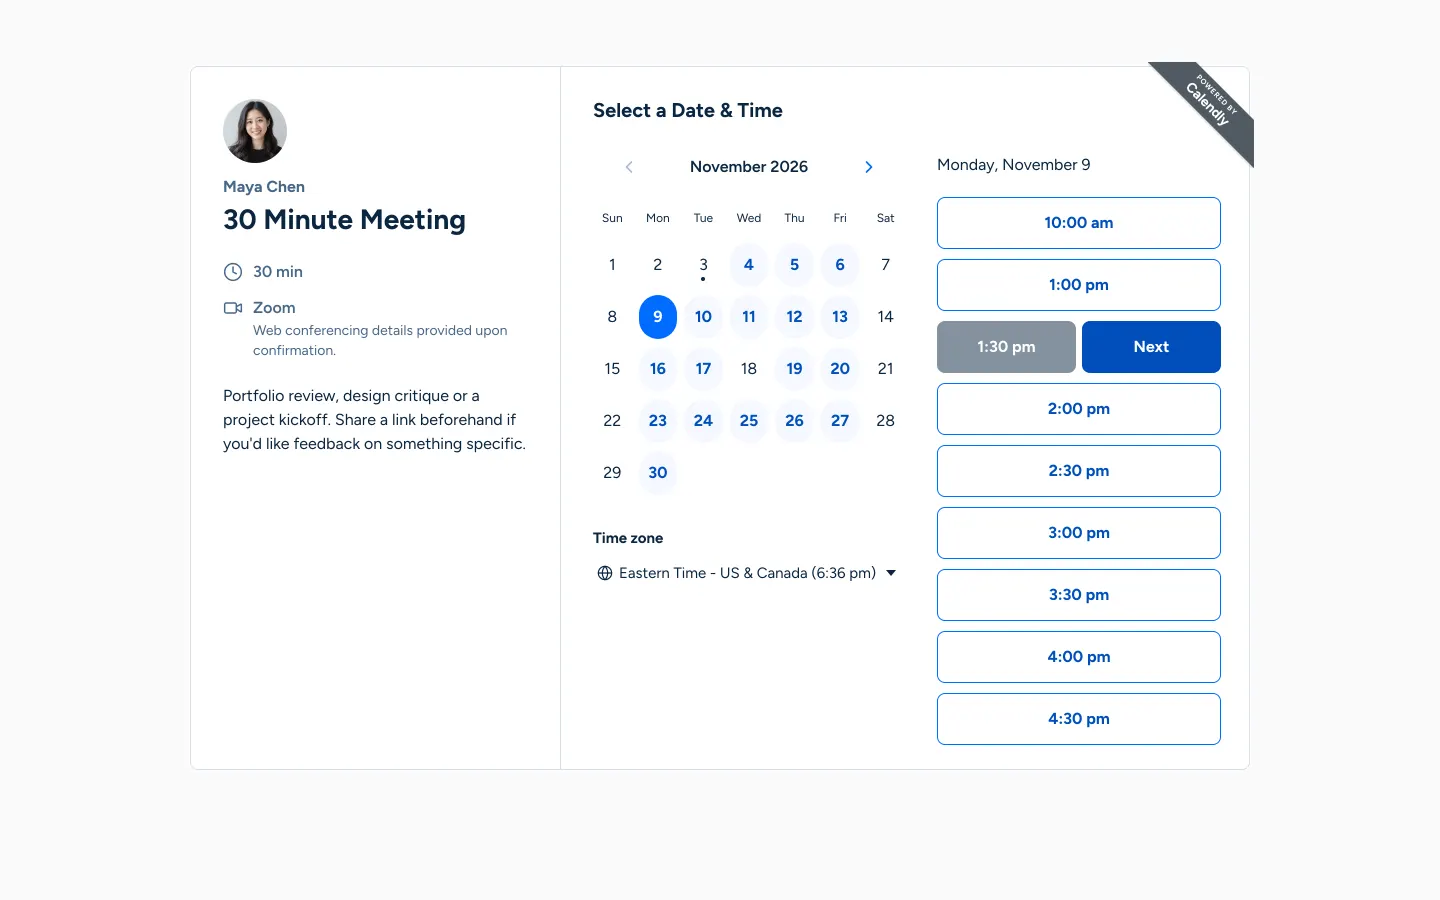
Calendly Clone
WebYour own Calendly: booking links that respect weekly hours, buffers and time zones, and never double-book.